Contents
- Index
- Previous
- Next
Overlap Percentage
This powerful feature allows the time axis on the Spectrogram and 3-D Surface plot to be "stretched" by re-processing portions of the time series. The setting determines what percentage of the FFT size block of data points is re-used for the next trace. High overlap percentages (90+%) and low FFT block sizes provide the highest time resolution but take longer to process the data file. This feature is only used in Post-Processing mode.
Large FFT sizes produce high frequency resolution but poor time resolution while low FFT sizes have the opposite effect. Overlap processing can be used to provide high resolution in both the frequency and time axis. For example, if a signal contains two discrete tones separated in frequency, only one of which is on at a time, it is difficult to discern the relative timing of each tone because both frequencies are often contained within a single FFT size time series block. If we perform an FFT and, instead of moving forward a whole FFT size block in the series, move forward only a small amount then we can isolate the pulse timing for each tone. The following figure illustrates the effect of overlap processing
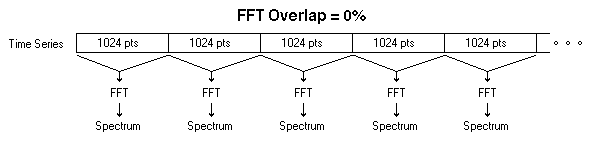
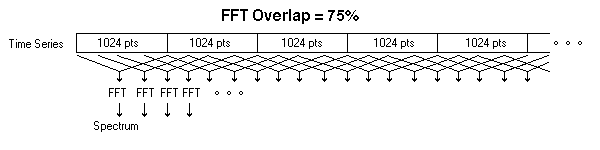
Notice that 4 times as many FFT's are performed in the second case; this will increase the time resolution by a factor of 4.
The program can automatically compute and use the optimum overlap percentage for you. Using either the Time Series, 3-D Surface or Spectrogram plots, simply select a time segment for editing and right click anywhere in the plot. An Action Menu will appear with choices such as "Compute and Display Spectrogram". The analyzer will automatically compute the overlap percentage necessary to fill the plot from the selected time segment. See the Right Click Action Menu topic for more details.
Notes:
High overlap percentages will require greater processing times.
See also: Right Click Action Menus, FFT size , Smoothing Windows,